Last trading day
Matched Volume
Market Share
Routed Volume
Data from | Matched Volume is single-counted
Record stats
| Matched Volume | Market Share | Routed Volume | Lit Volume |
|---|---|---|---|
Recent stats
| Total Shares Handled | Routed Volume | Matched Volume | Lit Volume | Market Share |
|---|
* Total Shares Handled = Single-counted matched + Routed Volume. * Lit Volume is volume traded against booked orders marked as displayed or booked portions of orders marked as displayed; matched volume includes trades against all booked orders, regardless of display type. * Routed Volume is single-counted. * Market Share = Single-counted Matched Volume divided by total market volume. * Highlighted stats are record highs to date
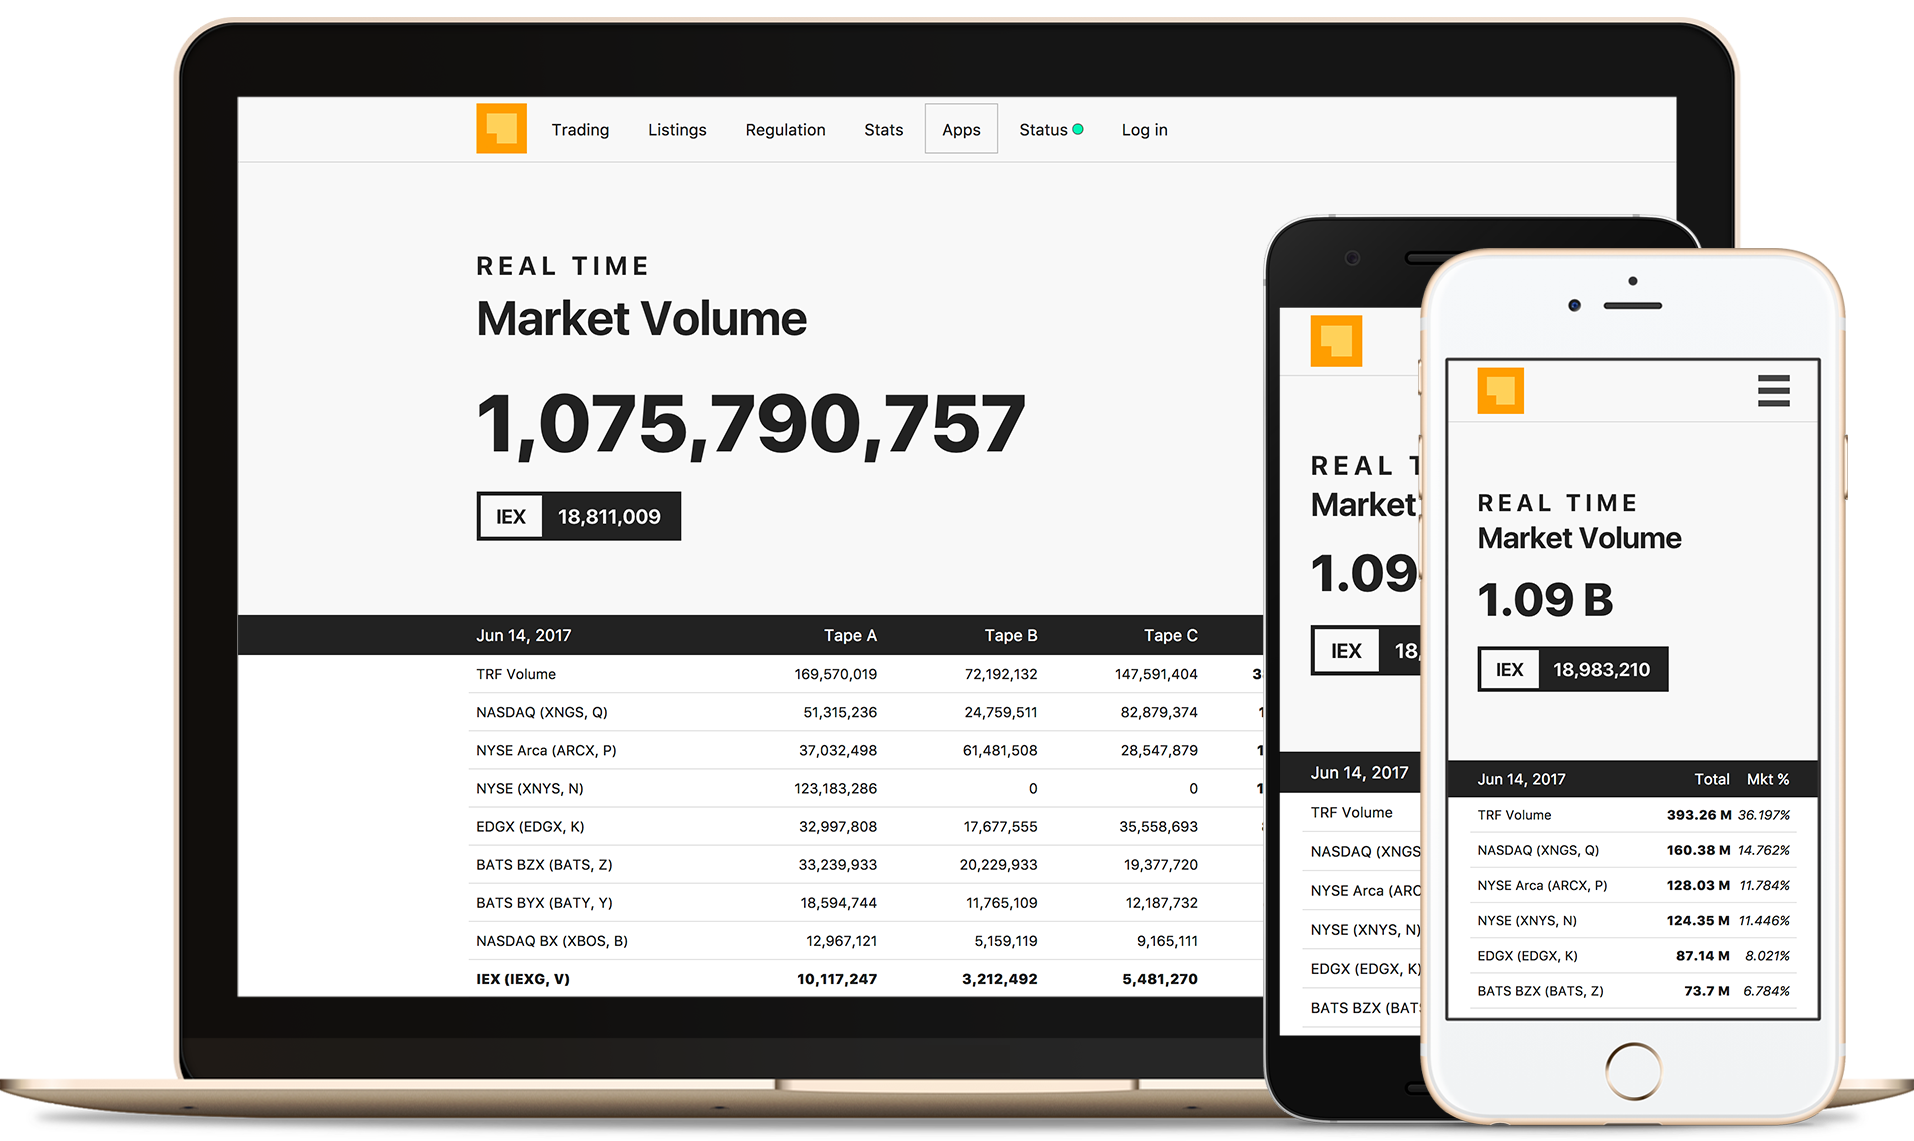
Market
The Market App shows near-real-time volume and market share for the trading day on each U.S. equities exchange and the TRF.
Historical stats
Stats
| Avg Routed Volume | Avg Matched Volume | |
|---|---|---|
| IEX | |
|---|---|
| Average Order Size | |
| Average Aggregate Fill Size |
| IEX | |
|---|---|
| % of Aggregate Fills: 100 Shares | |
| % of Aggregate Fills: 101-199 Shares | |
| % of Aggregate Fills: 200-299 Shares | |
| % of Aggregate Fills: 300-399 Shares | |
| % of Aggregate Fills: 400-499 Shares | |
| % of Aggregate Fills: 500-999 Shares | |
| % of Aggregate Fills: 1,000-4,999 Shares | |
| % of Aggregate Fills: 5,000 - 9,999 shares | |
| % of Aggregate Fills: >= 10,000 shares |
| # | |
|---|---|
| # of Trades: 10,000-19,999 shares | 4,714 |
| # of Trades: 20,000-49,999 shares | 1,504 |
| # of Trades: 50,000+ shares | 211 |
| Unique Symbols Traded | 7,461 |
| Average Daily Symbols Traded | 5,307 |
| % Shares Traded in Blocks | 7.90% |
| Broker Members | 153 |
| Broker Self-Cross | 3.02% |
| Market Capitalization | ADV Distribution |
|---|---|
| Large (>$10B) | |
| Mid ($2B-$10B) | |
| Small (<$2B) | |
| ETF |
Retail program stats
Please find more information about the IEX Exchange Retail Program here.
November 2021
All symbols
Symbol-by-symbol: Download here
* Symbol-by-symbol data only includes datapoints comprised of a minimum required number of Members, per IEX Exchange’s Member Agreement. Markouts are calculated on a trade-to-mid basis, mils markouts are share-weighted, and spread/bps markouts are notionally weighted.Daily stats
| Total Shares Handled | Routed Volume | Matched Volume | Lit Volume | Market Share |
|---|
* Total Shares Handled = Single-counted matched + Routed Volume. * Lit Volume is volume traded against booked orders marked as displayed or booked portions of orders marked as displayed; matched volume includes trades against all booked orders, regardless of display type. * Routed Volume is single-counted. * Market Share = Single-counted Matched Volume divided by total market volume. * Highlighted stats are record highs to date
Router stats
| # | |
|---|---|
| Average Daily Routed Volume |
Fill rates for away exchange families below with total weighted average fill rate across all Reg NMS "protected" market centers:
| Venue | First Wave Weight | First Wave Fill Rate* | |
|---|---|---|---|
| New York Stock Exchange (XNYS) | - | - | |
| NYSE Arca (ARCX) | - | - | |
| NYSE American (XASE) | - | - | |
| NYSE National (XCIS) | - | - | |
| NYSE Chicago (XCHI) | - | - | |
| Nasdaq Stock Exchange (XNGS) | - | - | |
| Nasdaq BX (XBOS) | - | - | |
| Nasdaq PSX (XPHL) | - | - | |
| Cboe BZX (BATS) | - | - | |
| Cboe BYX (BATY) | - | - | |
| Cboe EDGX (EDGX) | - | - | |
| Cboe EDGA (EDGA) | - | - | |
| IEX (IEXG) | - | - | |
| Total Weighted Average Fill Rate | |||
*Method of calculation: First Wave Fill Rate
For each order routed upon receipt by the Exchange to protected quotations at the National Best Bid and Offer ("NBBO"), the first wave fill rate ("fill rate") is calculated by dividing the number of shares filled at an away venue by the lesser of either the size of the order or quoted shares at such venue.1 The maximum fill rate for an order is 100%, never greater; therefore, if the IEX Router sent an oversized order (i.e., order size greater than quoted shares) and receives a fill larger than the displayed quotation at the venue, the fill rate would be 100%.
To illustrate with several examples:
- Example 1: Fill Less than Quoted Shares
2,000 shares are displayed at a venue, the IEX Router routes an order for 2,200 shares to the venue. 1,500 shares are filled of the 2,000 displayed that the router attempted to capture, so the fill rate is 75% (1500 ÷ 2000 = 0.75).
- Example 2: Fill Less than Order Size
2,000 shares are displayed at a venue, the IEX Router routes an order for 1,000 shares to the venue. 500 shares are filled of the 1,000 the router attempted to capture, so the fill rate is 50% (500 ÷ 1000 = 0.5).
- Example 3: Fill Greater than Quoted Shares
2,000 shares are displayed at a venue, the IEX Router routes an order for 3,000 to the venue. 2,500 shares are filled of the 2,000 displayed, so the fill rate is 100% (2500 > 2000, therefore 1).
1 Exclusions:
- Orders routed at prices more aggressive than the NBBO after all shares at the NBBO have been exhausted (if the order’s limit is more aggressive than the NBBO upon receipt).
- Orders from subsequent routing waves attempting to capture reserve liquidity at the same price level (e.g., "double pump").
- Short sale orders not marked short exempt for covered securities subject to Rule 201 of Regulation SHO that are subject to the Short Sale Price Test (exclusion started in January 2017).
- Non-marketable orders that rest on the IEX Order Book upon receipt by the Exchange, which may subsequently route in accordance with Re-sweep behavior (exclusion started in January 2017).
The above data is designed to reflect the standard experience of brokers utilizing the IEX router, and excludes a limited number of select brokers who use the router in a non-standard manner - namely simultaneously routing to other exchanges while sending IEX routable orders.
How we count shares
- "Single-counted" is volume matched.
- IEX market share is IEX traded volume (single-counted) divided by total market volume. Note - IEX only trades 8:00am-5:00pm, but calculates IEX market share versus all market activity between 4:00am-8:00pm.
- A member's market share is its volume divided by total member volume.